added 16 characters in body
Source Link
Malabarba
  • 23.3k
  • 6
  • 81
  • 166

Benchmark

The most straightforward options is the built-in benchmark package. Its usage is remarkably simple:

(benchmark 100 (form (to be evaluated)))

It’s autoloaded, so you don’t even need to require it.

Profiling

Benchmark is good at overall tests, but if you’re having performance problems it doesn’t tell you which functions are causing the problem. For that, you have the (also built-in) profiler.

  1. Start it with M-x profiler-start.
  2. Do some time consuming operations.
  3. Get the report with M-x profiler-report.

You should be taken to a buffer with a navigatable tree of function calls.
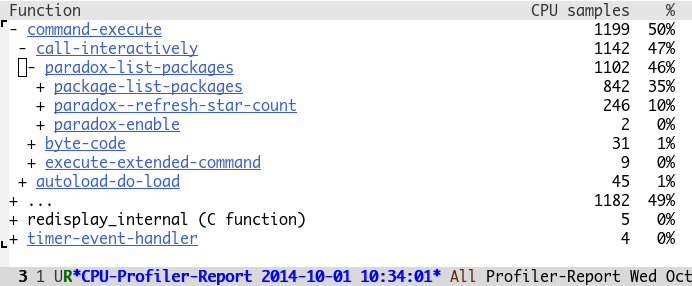
Profiler screenshot

Benchmark

The most straightforward options is the built-in benchmark package. Its usage is remarkably simple:

(benchmark 100 (form (to be evaluated)))

It’s autoloaded, so you don’t even need to require it.

Profiling

Benchmark is good at overall tests, but if you’re having performance problems it doesn’t tell you which functions are causing the problem. For that, you have the profiler.

  1. Start it with M-x profiler-start.
  2. Do some time consuming operations.
  3. Get the report with M-x profiler-report.

You should be taken to a buffer with a navigatable tree of function calls.
Profiler screenshot

Benchmark

The most straightforward options is the built-in benchmark package. Its usage is remarkably simple:

(benchmark 100 (form (to be evaluated)))

It’s autoloaded, so you don’t even need to require it.

Profiling

Benchmark is good at overall tests, but if you’re having performance problems it doesn’t tell you which functions are causing the problem. For that, you have the (also built-in) profiler.

  1. Start it with M-x profiler-start.
  2. Do some time consuming operations.
  3. Get the report with M-x profiler-report.

You should be taken to a buffer with a navigatable tree of function calls.
Profiler screenshot

Source Link
Malabarba
  • 23.3k
  • 6
  • 81
  • 166

Benchmark

The most straightforward options is the built-in benchmark package. Its usage is remarkably simple:

(benchmark 100 (form (to be evaluated)))

It’s autoloaded, so you don’t even need to require it.

Profiling

Benchmark is good at overall tests, but if you’re having performance problems it doesn’t tell you which functions are causing the problem. For that, you have the profiler.

  1. Start it with M-x profiler-start.
  2. Do some time consuming operations.
  3. Get the report with M-x profiler-report.

You should be taken to a buffer with a navigatable tree of function calls.
Profiler screenshot