How do I measure the performance of my elisp code? What tools / external packages are available for me to measure time taken?
In addition to total time, can I see a profile that shows time taken per-function? Can I profile memory usage too?
The most straightforward options is the built-in benchmark package.
Its usage is remarkably simple:
(benchmark 100 (form (to be evaluated)))
It’s autoloaded, so you don’t even need to require it.
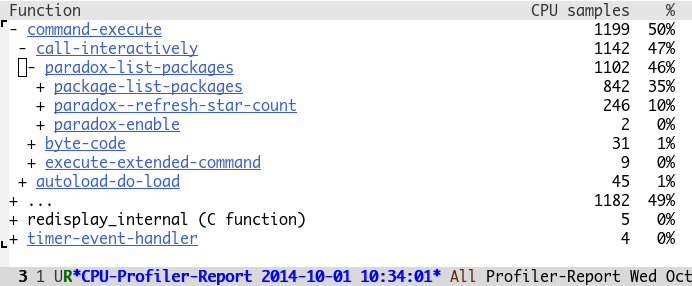
Benchmark is good at overall tests, but if you’re having performance problems it doesn’t tell you which functions are causing the problem. For that, you have the (also built-in) profiler.
M-x profiler-start. M-x profiler-report.You should be taken to a buffer with a navigatable tree of function calls.

benchmark function doesn't seem to work: when I do inside an opened .c file (benchmark 100 (c-font-lock-fontify-region 0 17355)), I keep getting void-function jit-lock-bounds.
benchmark there are functions benchmark-run and benchmark-run-compiled. For me the main difference was that both functions actually work (see the prev. comment) :Ь
In addition to @Malabara's answer, I tend to use a custom-made with-timer macro to permanently instrument various parts of my code (e.g my init.el file).
The difference is that while benchmark allows to study the performance of a specific bit of code that you instrument, with-timer always gives you the time spent in each instrumented part of the code (without much overhead for sufficiently large parts), which gives you the input to know which part should be investigated further.
(defmacro with-timer (title &rest forms)
  "Run the given FORMS, counting the elapsed time.
A message including the given TITLE and the corresponding elapsed
time is displayed."
  (declare (indent 1))
  (let ((nowvar (make-symbol "now"))
        (body   `(progn ,@forms)))
    `(let ((,nowvar (current-time)))
       (message "%s..." ,title)
       (prog1 ,body
         (let ((elapsed
                (float-time (time-subtract (current-time) ,nowvar))))
           (message "%s... done (%.3fs)" ,title elapsed))))))
Example use:
(with-timer "Doing things"
  (form (to (be evaluated))))
yielding the following output in the *Messages* buffer:
Doing things... done (0.047s)
I should mention that this is heavily inspired by Jon Wiegley's use-package-with-elapsed-timer macro in his excellent use-package extension.
emacs-init-time.
esup and I like it. But once again, the interest of such a thing as with-timer is not so much to profile something thorougly. The real interest is that you always have profiling information. Whenever I start emacs, I have a buch of lines in my *Messages* buffer that tell me which part took how long. If I detect anything abnormal, I can then use any of the more adequate tools to profile and optimize things.
Commented
Oct 1, 2014 at 14:20
emacs-init-time does produce interesting information. However, it only gives an inclusive elapsed time, without the possibility to break down individual parts of the initialization.
Commented
Oct 1, 2014 at 14:22
In addition to @Malabarba's answer, note that you can measure the compiled execution time of your code with benchmark-run-compiled. That metric is often much more relevant than the interpreted execution time that M-x benchmark gives you:
ELISP> (benchmark-run (cl-loop for i below (* 1000 1000) sum i))
(0.79330082 6 0.2081620540000002)

ELISP> (benchmark-run-compiled (cl-loop for i below (* 1000 1000) sum i))
(0.047896284 0 0.0)
The three numbers are the total elapsed time, the number of GC runs, and the time spent in GC.
Benchmarking is not only about getting the numbers, it is also about making decisions based on result analysis.
There is benchstat.el package on MELPA which you can use to get features that benchstat program provides.
It implements comparison-based benchmarking where you examine X performance properties against Y.
Benchstat functions can be viewed as a benchmark-run-compiled wrapper that not only collects the information, but gives it back in easy to read an interpret format. It includes:
X and YVery simple usage example:
(require 'benchstat)

;; Decide how much repetitions is needed.
;; This is the same as `benchmark-run-compiled` REPETITIONS argument.
(defconst repetitions 1000000)

;; Collect old code profile.
(benchstat-run :old repetitions (list 1 2))
;; Collect new code profile.
(benchstat-run :new repetitions (cons 1 2))

;; Display the results.
;; Can be run interactively by `M-x benchstat-compare'.
(benchstat-compare)
The benchstat-compare will render results in a temporary buffer:
name   old time/op    new time/op    delta
Emacs    44.2ms ± 6%    25.0ms ±15%  -43.38%  (p=0.000 n=10+10)

name   old allocs/op  new allocs/op  delta
Emacs      23.0 ± 0%      11.4 ± 5%  -50.43%  (p=0.000 n=10+10)
You will need benchstat program binary though.
If you used Go programming language, most likely you have one in your
system already.
Otherwise there is an option of compiling it from the sources.
Precompiled binary for linux/amd64 can be found at github release page.
benchmarkand the profiler does not measure Emacs performance. It measures the performance evaluating particular expressions. It is helpful in comparing performances within Emacs. To measure the performance of Emacs itself you would need to compare it to the performance of something other than Emacs. And that is where the breadth of Emacs comes into play. You could measure Emacs vs XYZ for this or that, but to measure Emacs performance as a whole you would need umpteen such comparisons.